BRUSSELS--(BUSINESS WIRE)--Anheuser-Busch InBev (Brussel:ABI) (BMV:ANB) (JSE:ANH) (NYSE:BUD):
Regulated information1
“Beer is a passion point for consumers. The resilience of the beer category and the continued momentum of our megabrands delivered another quarter of profitable growth. EBITDA increased by 6.5% and the ongoing optimization of our business drove Underlying EPS growth of 8.7%. While the operating environment remains dynamic, the consistent execution of our strategy by our teams and partners drove a solid first half of the year and reinforces our confidence in delivering on our outlook for 2025.” – Michel Doukeris, CEO, AB InBev
| Revenue +3.0% Revenue increased by 3.0% in 2Q25 with revenue per hl growth of 4.9% and by 2.3% in HY25 with revenue per hl growth of 4.3%.
Reported revenue decreased by 2.1% in 2Q25 to 15 004 million USD and by 4.2% in HY25 to 28 632 million USD, impacted by unfavorable currency translation.
5.6% increase in combined revenues of our megabrands, led by Corona, which grew by 7.7% outside of its home market in 2Q25.
33% increase in revenue of our no-alcohol beer portfolio in 2Q25.
63% increase in Gross Merchandise Value (GMV) from sales of third-party products through BEES Marketplace to reach 785 million USD in 2Q25.
Volumes -1.9% Volumes declined by 1.9% in 2Q25, with beer volumes down by 2.2% and non-beer volumes up by 0.3%.
Volumes declined by 2.0% in HY25, with beer volumes down by 2.3% and non-beer volumes flat.
| Normalized EBITDA +6.5% Normalized EBITDA increased by 6.5% to 5 301 million USD in 2Q25, with a margin expansion of 116bps to 35.3%. Normalized EBITDA increased by 7.2% to 10 156 million USD in HY25, with a margin expansion of 166bps to 35.5%.
Underlying Profit 1 950 million USD Underlying Profit was 1 950 million USD in 2Q25 compared to 1 811 million USD in 2Q24 and was 3 556 million USD in HY25 compared to 3 320 million USD in HY24.
Reported profit attributable to equity holders of AB InBev was 1 676 million USD in 2Q25 compared to 1 472 million USD in 2Q24, negatively impacted by non-underlying items, and was 3 824 million in HY25 compared to 2 564 million in HY24, positively impacted by non-underlying items.
Underlying EPS 0.98 USD Underlying EPS increased by 8.7% to 0.98 USD in 2Q25, compared to 0.90 USD in 2Q24, and increased by 8.0% to 1.79 USD in HY25, compared to 1.66 USD in HY24.
On a constant currency basis, Underlying EPS increased by 17.4% in 2Q25 and by 18.7% in HY25. |
| Net Debt to EBITDA 3.27x Net debt to normalized EBITDA ratio was 3.27x at 30 June 2025 compared to 3.42x at 30 June 2024 and 2.89x at 31 December 24. | |
| The 2025 Half Year Financial Report is available on our website at www.ab-inbev.com |
| 1The enclosed information constitutes regulated information as defined in the Belgian Royal Decree of 14 November 2007 regarding the duties of issuers of financial instruments which have been admitted for trading on a regulated market. For important disclaimers and notes on the basis of preparation, please refer to page 16. |
Management comments
Consistent execution of our strategy delivered an EBITDA increase of 6.5%, continued margin expansion and high-single digit Underlying EPS growth
Our 2Q25 and HY25 results demonstrate the resilience of our strategy and ability of our business to deliver reliable compounding growth. In 2Q25, increased investments in our brands, expansion of our premium portfolio and innovation in balanced choices, combined with our revenue management decisions drove an acceleration in revenue growth, top- and bottom line increases in four of our five operating regions and continued growth in our overall portfolio brand power.
Revenue increased in 70% of our markets and by 3.0% overall, driven by a revenue per hl increase of 4.9%. Volumes declined by 1.9%, impacted by soft industries and performance in China and Brazil. While overall volumes were below potential, underlying momentum continued in the remainder of our footprint, with volume growth of 0.7% outside of these two countries. Top-line growth combined with disciplined resource allocation and overhead management drove an EBITDA increase of 6.5%, margin expansion of 116bps and Underlying EPS growth of 17.4% in constant currency and 8.7% in USD to reach 0.98 USD.
Progressing our strategic priorities
We continue to execute on and invest in three key strategic pillars to deliver consistent growth and long-term value creation.
(1) Lead and grow the category:
Our overall portfolio brand power grew in 2Q25 driven by increased marketing investment and effectiveness. In addition, we estimate that we gained or maintained market share in 60% of our markets in HY25.
(2) Digitize and monetize our ecosystem:
BEES Marketplace captured 785 million USD in GMV from sales of third-party products, a 63% increase versus 2Q24. Overall BEES GMV increased by 10% versus 2Q24, reaching 12.2 billion USD.
(3) Optimize our business:
We continued to make progress on deleveraging with net debt to EBITDA reaching 3.27x as of 30 June 2025 versus 3.42x as of 30 June 2024. In HY25, we invested 5.0 billion USD in capex and sales and marketing while delivering free cash flow of approximately 1.4 billion USD, a 0.5 billion USD increase versus HY24.
(1) Lead and grow the category
Our performance across each of our category expansion levers drove an estimated increase in the percentage of legal drinking age consumers purchasing our portfolio across our key markets, with increases led by our megabrands and no-alcohol beer portfolio. We continue to invest in our megabrands and mega platforms with our sales and marketing investments increasing to 3.6 billion USD in HY25, a 4% increase versus HY24. According to the Kantar BrandZ 2025 report, our portfolio holds 8 of the top 10 most valuable beer brands in the world, with Corona and Budweiser #1 and #2 respectively. Our marketing effectiveness and creativity were recognized by being named the most effective marketer in the world by both Effies and the World Advertising Research Center for the 4th year in a row.
(2) Digitize and monetize our ecosystem
(3) Optimize our business
Delivering reliable compounding growth
In the first half of this year, our business delivered an EBITDA increase of 7.2% with margin expansion of 166bps and Underlying EPS growth of 8.0% in USD. We made strategic choices across revenue management, resource allocation, and increased sales and marketing investments to lead and grow the category. We continued to make progress on deleveraging while paying an increased dividend to our shareholders and completing our 2 billion USD share buyback program. Our footprint has structural tailwinds for long-term volume growth with favorable demographics, ongoing economic development and opportunities to increase category participation. Our consistent performance and the fundamental strengths of our business reinforce our confidence in our ability to deliver our FY25 outlook and long-term value creation.
2025 Outlook
(i) Overall Performance: We expect our EBITDA to grow in line with our medium-term outlook of between 4-8%. The outlook for FY25 reflects our current assessment of inflation and other macroeconomic conditions.
(ii) Net Finance Costs: Net pension interest expenses and accretion expenses are expected to be in the range of 190 to 220 million USD per quarter, depending on currency and interest rate fluctuations. We expect the average gross debt coupon in FY25 to be approximately 4%.
(iii) Effective Tax Rate (ETR): We expect the normalized ETR in FY25 to be in the range of 26% to 28%. The ETR outlook does not consider the impact of potential future changes in legislation.
(iv) Net Capital Expenditure: We expect net capital expenditure of between 3.5 and 4.0 billion USD in FY25.
| Figure 1. Consolidated performance | |||||||||
| in USD Mio, except EPS in USD per share and Volumes in thousand hls | 2Q24 | 2Q25 | Organic | ||||||
| growth | |||||||||
| Volumes | 146 302 |
| 143 347 |
| (1.9 | )% | |||
| Beer | 127 242 |
| 124 778 |
| (2.2 | )% | |||
| Non-Beer | 19 059 |
| 18 569 |
| 0.3 | % | |||
| Revenue | 15 333 |
| 15 004 |
| 3.0 | % | |||
| Gross profit | 8 567 |
| 8 446 |
| 4.0 | % | |||
| Gross margin | 55.9 | % | 56.3 | % | 55bps | ||||
| Normalized EBITDA | 5 302 |
| 5 301 |
| 6.5 | % | |||
| Normalized EBITDA margin | 34.6 | % | 35.3 | % | 116bps | ||||
| Normalized EBIT | 3 905 |
| 4 013 |
| 10.2 | % | |||
| Normalized EBIT margin | 25.5 | % | 26.7 | % | 179bps | ||||
|
| |||||||||
| Profit attributable to equity holders of AB InBev | 1 472 |
| 1 676 |
| |||||
| Underlying Profit | 1 811 |
| 1 950 |
| |||||
|
| |||||||||
| Basic EPS | 0.73 |
| 0.84 |
| |||||
| Underlying EPS | 0.90 |
| 0.98 |
| |||||
| HY24 | HY25 | Organic | |||||||
| growth | |||||||||
| Volumes | 285 837 |
| 279 615 |
| (2.0 | )% | |||
| Beer | 246 767 |
| 241 390 |
| (2.3 | )% | |||
| Non-Beer | 39 070 |
| 38 225 |
| 0.0 | % | |||
| Revenue | 29 880 |
| 28 632 |
| 2.3 | % | |||
| Gross profit | 16 461 |
| 16 029 |
| 4.6 | % | |||
| Gross margin | 55.1 | % | 56.0 | % | 127bps | ||||
| Normalized EBITDA | 10 288 |
| 10 156 |
| 7.2 | % | |||
| Normalized EBITDA margin | 34.4 | % | 35.5 | % | 166bps | ||||
| Normalized EBIT | 7 547 |
| 7 601 |
| 10.3 | % | |||
| Normalized EBIT margin | 25.3 | % | 26.5 | % | 198bps | ||||
|
| |||||||||
| Profit attributable to equity holders of AB InBev | 2 564 |
| 3 824 |
| |||||
| Underlying Profit | 3 320 |
| 3 556 |
| |||||
|
| |||||||||
| Basic EPS | 1.28 |
| 1.92 |
| |||||
| Underlying EPS | 1.66 |
| 1.79 |
| |||||
| Figure 2. Volumes | ||||||||||||||||
| in thousand hls | 2Q24 | Scope | Organic | 2Q25 | Organic growth | |||||||||||
| growth | Total | Beer | ||||||||||||||
| North America | 22 639 | (330 | ) | 68 |
| 22 376 | 0.3 | % | (0.0 | )% | ||||||
| Middle Americas | 38 381 | - |
| 441 |
| 38 822 | 1.1 | % | 1.5 | % | ||||||
| South America | 35 969 | - |
| (1 770 | ) | 34 199 | (4.9 | )% | (6.8 | )% | ||||||
| EMEA | 23 852 | 112 |
| 208 |
| 24 172 | 0.9 | % | 0.6 | % | ||||||
| Asia Pacific | 25 399 | - |
| (1 683 | ) | 23 716 | (6.6 | )% | (6.5 | )% | ||||||
| Global Export and Holding Companies | 62 | (6 | ) | 6 |
| 62 | 10.4 | % | 10.4 | % | ||||||
| AB InBev Worldwide | 146 302 | (224 | ) | (2 730 | ) | 143 347 | (1.9 | )% | (2.2 | )% | ||||||
| HY24 | Scope | Organic | HY25 | Organic growth | ||||||||||||
| growth | Total | Beer | ||||||||||||||
| North America | 43 992 | (474 | ) | (1 299 | ) | 42 218 | (3.0 | )% | (3.2 | )% | ||||||
| Middle Americas | 74 072 | - |
| (169 | ) | 73 903 | (0.2 | )% | 0.1 | % | ||||||
| South America | 76 315 | - |
| (1 226 | ) | 75 089 | (1.6 | )% | (2.5 | )% | ||||||
| EMEA | 44 882 | 77 |
| (35 | ) | 44 924 | (0.1 | )% | (0.4 | )% | ||||||
| Asia Pacific | 46 444 | (93 | ) | (2 987 | ) | 43 365 | (6.4 | )% | (6.3 | )% | ||||||
| Global Export and Holding Companies | 132 | (9 | ) | (7 | ) | 116 | (5.7 | )% | (5.7 | )% | ||||||
| AB InBev Worldwide | 285 837 | (498 | ) | (5 724 | ) | 279 615 | (2.0 | )% | (2.3 | )% | ||||||
Key Markets Performance
United States: Michelob Ultra momentum drove continued market share gain and top- and bottom-line growth
Mexico: Continued momentum drove mid-single digit top- and bottom-line growth
Colombia: Record high volume drove high single-digit top- and bottom-line growth
Brazil: Revenue declined by 1.9% impacted by volume; disciplined revenue and cost management drove mid-single digit bottom-line growth with margin expansion
Europe: Improved industry, continued premiumization and margin recovery delivered top- and bottom-line growth
South Africa: Continued momentum and market share gain delivered mid-single digit top- and bottom-line growth
China: Revenue declined by 6.2% impacted by volume performance
Highlights from our other markets
Consolidated Income Statement
| Figure 3. Consolidated income statement | |||||||||
| in USD Mio | 2Q24 | 2Q25 | Organic | ||||||
| growth | |||||||||
| Revenue | 15 333 |
| 15 004 |
| 3.0 | % | |||
| Cost of sales | (6 766 | ) | (6 558 | ) | (1.7 | )% | |||
| Gross profit | 8 567 |
| 8 446 |
| 4.0 | % | |||
| SG&A | (4 813 | ) | (4 624 | ) | 0.0 | % | |||
| Other operating income/(expenses) | 151 |
| 191 |
| 35.2 | % | |||
| Normalized EBIT | 3 905 |
| 4 013 |
| 10.2 | % | |||
| Non-underlying items above EBIT | (90 | ) | (45 | ) | |||||
| Net finance income/(expense) | (1 170 | ) | (1 062 | ) | |||||
| Non-underlying net finance income/(expense) | (221 | ) | (234 | ) | |||||
| Share of results of associates | 79 |
| 84 |
| |||||
| Non-underlying share of results of associates | - |
| 9 |
| |||||
| Income tax expense | (752 | ) | (741 | ) | |||||
| Profit | 1 751 |
| 2 024 |
| |||||
| Profit attributable to non-controlling interest | 279 |
| 347 |
| |||||
| Profit attributable to equity holders of AB InBev | 1 472 |
| 1 676 |
| |||||
| Normalized EBITDA | 5 302 |
| 5 301 |
| 6.5 | % | |||
| Underlying Profit | 1 811 |
| 1 950 |
| |||||
| HY24 | HY25 | Organic | |||||||
| growth | |||||||||
| Revenue | 29 880 |
| 28 632 |
| 2.3 | % | |||
| Cost of sales | (13 419 | ) | (12 602 | ) | 0.7 | % | |||
| Gross profit | 16 461 |
| 16 029 |
| 4.6 | % | |||
| SG&A | (9 248 | ) | (8 812 | ) | (0.6 | )% | |||
| Other operating income/(expenses) | 334 |
| 383 |
| 20.8 | % | |||
| Normalized EBIT | 7 547 |
| 7 601 |
| 10.3 | % | |||
| Non-underlying items above EBIT | (119 | ) | (94 | ) | |||||
| Net finance income/(expense) | (2 357 | ) | (2 046 | ) | |||||
| Non-underlying net finance income/(expense) | (530 | ) | 368 |
| |||||
| Share of results of associates | 137 |
| 135 |
| |||||
| Non-underlying share of results of associates | 104 |
| 9 |
| |||||
| Income tax expense | (1 546 | ) | (1 404 | ) | |||||
| Profit | 3 236 |
| 4 568 |
| |||||
| Profit attributable to non-controlling interest | 672 |
| 744 |
| |||||
| Profit attributable to equity holders of AB InBev | 2 564 |
| 3 824 |
| |||||
| Normalized EBITDA | 10 288 |
| 10 156 |
| 7.2 | % | |||
| Underlying Profit | 3 320 |
| 3 556 |
| |||||
Non-underlying items above EBIT & Non-underlying share of results of associates
| Figure 4. Non-underlying items above EBIT & Non-underlying share of results of associates | ||||||||||||
| in USD Mio | 2Q24 | 2Q25 | HY24 | HY25 | ||||||||
| Restructuring | (28 | ) | (35 | ) | (59 | ) | (47 | ) | ||||
| Business and asset disposal (incl. impairment losses) | (62 | ) | (10 | ) | (60 | ) | (47 | ) | ||||
| Non-underlying items in EBIT | (90 | ) | (45 | ) | (119 | ) | (94 | ) | ||||
| Non-underlying share of results of associates | - |
| 9 |
| 104 |
| 9 |
| ||||
Normalized EBIT excludes negative non-underlying items of 45 million USD in 2Q25 and 94 million USD in HY25. Non-underlying share of results from associates of HY24 included the impact from our associate Anadolu Efes’ adoption of IAS 29 hyperinflation accounting on their 2023 results.
Net finance income/(expense)
| Figure 5. Net finance income/(expense) | ||||||||||||
| in USD Mio | 2Q24 | 2Q25 | HY24 | HY25 | ||||||||
| Net interest expense | (721 | ) | (663 | ) | (1 399 | ) | (1 284 | ) | ||||
| Accretion expense and interest on pensions | (214 | ) | (184 | ) | (427 | ) | (351 | ) | ||||
| Other financial results | (235 | ) | (214 | ) | (530 | ) | (410 | ) | ||||
| Net finance income/(expense) | (1 170 | ) | (1 062 | ) | (2 357 | ) | (2 046 | ) | ||||
Non-underlying net finance income/(expense)
| Figure 6. Non-underlying net finance income/(expense) | |||||||||||
| in USD Mio | 2Q24 | 2Q25 | HY24 | HY25 | |||||||
| Mark-to-market | (264 | ) | (263 | ) | (507 | ) | 339 | ||||
| Gain/(loss) on bond redemption and other | 43 |
| 29 |
| (23 | ) | 29 | ||||
| Non-underlying net finance income/(expense) | (221 | ) | (234 | ) | (530 | ) | 368 | ||||
Non-underlying net finance cost in 2Q25 includes mark-to-market losses on derivative instruments entered into in order to hedge our share-based payment programs and shares issued in relation to the combination with Grupo Modelo and SAB.
The number of shares covered by the hedging of our share-based payment program, the deferred share instrument and the restricted shares are shown below, together with the opening and closing share prices.
| Figure 7. Non-underlying equity derivative instruments | ||||||||
| 2Q24 | 2Q25 | HY24 | HY25 | |||||
| Share price at the start of the period (Euro) | 56.46 | 56.92 | 58.42 | 48.25 | ||||
| Share price at the end of the period (Euro) | 54.12 | 58.24 | 54.12 | 58.24 | ||||
| Number of equity derivative instruments at the end of the period (millions) | 100.5 | 100.5 | 100.5 | 100.5 | ||||
Income tax expense
| Figure 8. Income tax expense | ||||||||||||
| in USD Mio | 2Q24 | 2Q25 | HY24 | HY25 | ||||||||
| Income tax expense | 752 |
| 741 |
| 1 546 |
| 1 404 |
| ||||
| Effective tax rate | 31.0 | % | 27.7 | % | 34.1 | % | 24.1 | % | ||||
| Normalized effective tax rate | 27.4 | % | 25.3 | % | 27.2 | % | 25.6 | % | ||||
The HY25 effective tax rate was positively impacted by non-taxable gains from derivatives related to the hedging of share-based payment programs and of the shares issued in a transaction related to the combinations with Grupo Modelo and SAB, while the HY24 effective tax rate was negatively impacted by non-deductible losses from these derivatives. Furthermore, HY24 effective tax rate included 133 million USD of non-underlying tax expense.
The decrease in Normalized ETR in 2Q25 compared to 2Q24 and HY25 compared to HY24 is driven mainly by country mix.
Underlying EPS
| Figure 9. Underlying EPS | ||||||||||||
| in USD per share, except number of shares in million | 2Q24 | 2Q25 | HY24 | HY25 | ||||||||
| Normalized EBITDA | 2.64 |
| 2.67 |
| 5.13 |
| 5.11 |
| ||||
| Depreciation, amortization and impairment | (0.70 | ) | (0.65 | ) | (1.37 | ) | (1.28 | ) | ||||
| Normalized EBIT | 1.95 |
| 2.02 |
| 3.76 |
| 3.82 |
| ||||
| Net finance income/(expense) | (0.58 | ) | (0.53 | ) | (1.18 | ) | (1.03 | ) | ||||
| Income tax expense | (0.37 | ) | (0.38 | ) | (0.70 | ) | (0.71 | ) | ||||
| Associates & non-controlling interests | (0.10 | ) | (0.13 | ) | (0.27 | ) | (0.31 | ) | ||||
| Hyperinflation impacts | 0.01 |
| 0.01 |
| 0.04 |
| 0.02 |
| ||||
| Underlying EPS | 0.90 |
| 0.98 |
| 1.66 |
| 1.79 |
| ||||
| Weighted average number of ordinary and restricted shares | 2 005 |
| 1 989 |
| 2 005 |
| 1 989 |
| ||||
Reconciliation of IFRS and Non-IFRS Financial Measures
Profit attributable to equity holders and Underlying Profit
| Figure 10. Underlying Profit | |||||||||
| in USD Mio | 2Q24 | 2Q25 | HY24 | HY25 | |||||
| Profit attributable to equity holders of AB InBev | 1 472 | 1 676 | 2 564 | 3 824 |
| ||||
| Net impact of non-underlying items on profit | 313 | 261 | 675 | (305 | ) | ||||
| Hyperinflation impacts | 26 | 14 | 81 | 37 |
| ||||
| Underlying Profit | 1 811 | 1 950 | 3 320 | 3 556 |
| ||||
Basic and Underlying EPS
| Figure 11. Basic and Underlying EPS | |||||||||
| in USD per share, except number of shares in million | 2Q24 | 2Q25 | HY24 | HY25 | |||||
| Basic EPS | 0.73 | 0.84 | 1.28 | 1.92 |
| ||||
| Net impact of non-underlying items | 0.16 | 0.13 | 0.34 | (0.15 | ) | ||||
| Hyperinflation impacts | 0.01 | 0.01 | 0.04 | 0.02 |
| ||||
| Underlying EPS | 0.90 | 0.98 | 1.66 | 1.79 |
| ||||
| FX translation impact | - | 0.08 | - | 0.17 |
| ||||
| Underlying EPS in constant currency | 0.90 | 1.06 | 1.66 | 1.96 |
| ||||
| Weighted average number of ordinary and restricted shares | 2 005 | 1 989 | 2 005 | 1 989 |
| ||||
Profit attributable to equity holders and Normalized EBITDA
| Figure 12. Reconciliation of Normalized EBITDA to Profit attributable to equity holders of AB InBev | ||||||||||||
| in USD Mio | 2Q24 | 2Q25 | HY24 | HY25 | ||||||||
| Profit attributable to equity holders of AB InBev | 1 472 |
| 1 676 |
| 2 564 |
| 3 824 |
| ||||
| Non-controlling interests | 279 |
| 347 |
| 672 |
| 744 |
| ||||
| Profit | 1 751 |
| 2 024 |
| 3 236 |
| 4 568 |
| ||||
| Income tax expense | 752 |
| 741 |
| 1 546 |
| 1 404 |
| ||||
| Share of result of associates | (79 | ) | (84 | ) | (137 | ) | (135 | ) | ||||
| Non-underlying share of results of associates | - |
| (9 | ) | (104 | ) | (9 | ) | ||||
| Net finance (income)/expense | 1 170 |
| 1 062 |
| 2 357 |
| 2 046 |
| ||||
| Non-underlying net finance (income)/expense | 221 |
| 234 |
| 530 |
| (368 | ) | ||||
| Non-underlying items above EBIT (incl. impairment losses) | 90 |
| 45 |
| 119 |
| 94 |
| ||||
| Normalized EBIT | 3 905 |
| 4 013 |
| 7 547 |
| 7 601 |
| ||||
| Depreciation, amortization and impairment | 1 397 |
| 1 288 |
| 2 741 |
| 2 555 |
| ||||
| Normalized EBITDA | 5 302 |
| 5 301 |
| 10 288 |
| 10 156 |
| ||||
Normalized EBITDA, Normalized EBIT and Underlying Profit are non-IFRS financial measures used by AB InBev to reflect the company’s underlying performance. Underlying EPS and constant currency Underlying EPS are non-IFRS financial measures that AB InBev believes are useful to investors because they facilitate comparisons of EPS from period to period.
Normalized EBITDA is calculated by adjusting profit attributable to equity holders of AB InBev to exclude: (i) non-controlling interest; (ii) income tax expense; (iii) share of results of associates; (iv) non-underlying share of results of associates; (v) net finance income or cost; (vi) non-underlying net finance income or cost; (vii) non-underlying items above EBIT; and (viii) depreciation, amortization and impairment.
Underlying Profit is calculated by adjusting profit attributable to equity holders of AB InBev to exclude: (i) non-underlying items and (ii) hyperinflation impacts. Underlying EPS is calculated as Underlying Profit divided by the weighted average number of ordinary and restricted shares. Constant currency Underlying EPS is calculated as Underlying EPS excluding the effects of foreign currency translation by translating current period figures using the exchange rates from the same period in the prior year.
Normalized EBITDA, Normalized EBIT and Underlying Profit are not accounting measures under IFRS and should not be considered as an alternative to profit attributable to equity holders as a measure of operational performance, or an alternative to cash flow as a measure of liquidity. Underlying EPS and constant currency Underlying EPS are not accounting measures under IFRS and should not be considered as alternatives to earnings per share as a measure of operating performance on a per share basis. These non-IFRS financial measures do not have a standard calculation method and AB InBev’s definition of Normalized EBITDA, Normalized EBIT, Underlying Profit, Underlying EPS and constant currency Underlying EPS may not be comparable to that of other companies.
Cash Flows and Financial Position
| Figure 13. Cash Flow Statement (million USD) | ||||||
| HY24 | HY25 | |||||
| Operating activities | ||||||
| Profit of the period | 3 236 |
| 4 568 |
| ||
| Interest, taxes and non-cash items included in profit | 7 588 |
| 5 736 |
| ||
| Cash flow from operating activities before changes in working capital and use of provisions | 10 824 |
| 10 304 |
| ||
|
| ||||||
| Change in working capital | (4 170 | ) | (3 655 | ) | ||
| Pension contributions and use of provisions | (251 | ) | (278 | ) | ||
| Interest and taxes (paid)/received | (3 958 | ) | (3 801 | ) | ||
| Dividends received | 123 |
| 135 |
| ||
| Cash flow from/(used in) operating activities | 2 568 |
| 2 704 |
| ||
|
| ||||||
| Investing activities | ||||||
| Net capex | (1 684 | ) | (1 350 | ) | ||
| Sale/(acquisition) of subsidiaries, net of cash | (19 | ) | (4 | ) | ||
| Net proceeds from sale/(acquisition) of other assets | (29 | ) | 47 |
| ||
| Cash flow from/(used in) investing activities | (1 732 | ) | (1 306 | ) | ||
|
| ||||||
| Financing activities | ||||||
| Net (repayments of) / proceeds from borrowings | 1 124 |
| 68 |
| ||
| Dividends paid | (2 142 | ) | (3 147 | ) | ||
| Share buyback | (838 | ) | (1 901 | ) | ||
| Payment of lease liabilities | (406 | ) | (354 | ) | ||
| Derivative financial instruments | (172 | ) | 114 |
| ||
| Sale/(acquisition) of non-controlling interests | (414 | ) | (314 | ) | ||
| Other financing cash flows | (465 | ) | (303 | ) | ||
| Cash flow from/(used in) financing activities | (3 313 | ) | (5 837 | ) | ||
| Net increase/(decrease) in cash and cash equivalents | (2 476 | ) | (4 438 | ) | ||
Our free cash flow (defined as cash flow from operating activities less net capex) increased by 470 million USD to reach 1 355 million USD in HY25. Our cash and cash equivalents decreased by 4 438 million USD in HY25, compared to a decrease of 2 476 million USD in HY24, with the following movements:
Our net debt increased to 68.1 billion USD as of 30 June 2025 from 60.6 billion USD as of 31 December 2024. Our net debt to normalized EBITDA ratio was 3.27x as of 30 June 2025. Our optimal capital structure is a net debt to normalized EBITDA ratio of around 2x.
We continue to proactively manage our debt portfolio. After bond repurchases of 3 billion USD and issuances of 3 billion Euro in HY25, 98% of our bond portfolio holds a fixed-interest rate, 50% is denominated in currencies other than USD and maturities are well-distributed across the next several years.
As of 30 June 2025, we had total liquidity of 17.5 billion USD, which consisted of 10.1 billion USD available under committed long-term credit facilities and 7.4 billion USD of cash, cash equivalents and short-term investments in debt securities less bank overdrafts.
Notes
To facilitate the understanding of AB InBev’s underlying performance, the analyses of growth, including all comments in this press release, unless otherwise indicated, are based on organic growth and normalized numbers. In other words, financials are analyzed eliminating the impact of changes in currencies on translation of foreign operations, and scope changes. Since 1Q24, the definition of organic revenue growth has been amended to cap the price growth in Argentina to a maximum of 2% per month (26.8% year-over-year). Corresponding adjustments are made to all income statement related items in the organic growth calculations through scope changes. Scope changes also represent the impact of acquisitions and divestitures, the start or termination of activities or the transfer of activities between segments, curtailment gains and losses and year over year changes in accounting estimates and other assumptions that management does not consider as part of the underlying performance of the business. The organic growth of our global brands, Budweiser, Stella Artois, and Corona excludes exports to Australia for which a perpetual license was granted to a third party upon disposal of the Australia operations in 2020. All references per hectoliter (per hl) exclude US non-beverage activities. Whenever presented in this document, all performance measures (EBITDA, EBIT, profit, tax rate, EPS) are presented on a “normalized” basis, which means they are presented before non-underlying items. Non-underlying items are either income or expenses which do not occur regularly as part of the normal activities of the Company. They are presented separately because they are important for the understanding of the underlying sustainable performance of the Company due to their size or nature. Normalized measures are additional measures used by management and should not replace the measures determined in accordance with IFRS as an indicator of the Company’s performance. We are reporting the results from Argentina applying hyperinflation accounting since 3Q18. The IFRS rules (IAS 29) require us to restate the year-to-date results for the change in the general purchasing power of the local currency, using official indices before converting the local amounts at the closing rate of the period. In 2Q25, we reported a negative impact from hyperinflation accounting on the profit attributable to equity holders of AB InBev of (14) million USD. The impact in 2Q25 Basic EPS was (0.01) USD. Values in the figures and annexes may not add up, due to rounding. 2Q25 and HY25 EPS is based upon a weighted average of 1 989 million shares compared to a weighted average of 2 005 million shares for 2Q24 and HY24.
Legal disclaimer
This release contains “forward-looking statements”. These statements are based on the current expectations and views of future events and developments of the management of AB InBev and are naturally subject to uncertainty and changes in circumstances. The forward-looking statements contained in this release include statements other than historical facts and include statements typically containing words such as “will”, “may”, “should”, “believe”, “intends”, “expects”, “anticipates”, “targets”, “ambition”, “estimates”, “likely”, “foresees” and words of similar import. All statements other than statements of historical facts are forward-looking statements. You should not place undue reliance on these forward-looking statements, which reflect the current views of the management of AB InBev, are subject to numerous risks and uncertainties about AB InBev and are dependent on many factors, some of which are outside of AB InBev’s control. There are important factors, risks and uncertainties that could cause actual outcomes and results to be materially different, including, but not limited to the risks and uncertainties relating to AB InBev that are described under Item 3.D of AB InBev’s Annual Report on Form 20-F filed with the SEC on 12 March 2025. Many of these risks and uncertainties are, and will be, exacerbated by any further worsening of the global business and economic environment, including as a result of foreign currency exchange rate fluctuations and ongoing geopolitical conflicts. Other unknown or unpredictable factors could cause actual results to differ materially from those in the forward-looking statements. The forward-looking statements should be read in conjunction with the other cautionary statements that are included elsewhere, including AB InBev’s most recent Form 20-F and other reports furnished on Form 6-K, and any other documents that AB InBev has made public. Any forward-looking statements made in this communication are qualified in their entirety by these cautionary statements and there can be no assurance that the actual results or developments anticipated by AB InBev will be realized or, even if substantially realized, that they will have the expected consequences to, or effects on, AB InBev or its business or operations. Except as required by law, AB InBev undertakes no obligation to publicly update or revise any forward-looking statements, whether as a result of new information, future events or otherwise. The half year 2025 (HY25) financial data set out in Figure 1 (except for the volume information), Figures 3 to 6, 8, 10, 12 and 13 of this press release have been extracted from the group’s unaudited condensed consolidated interim financial statements as of and for the six months ended 30 June 2025, which have been reviewed by our statutory auditors PwC Bedrijfsrevisoren BV /Réviseurs d’Entreprises SRL in accordance with the standards of the Public Company Accounting Oversight Board (United States). The second quarter 2025 (2Q25) financial data set out in Figure 1 (except for the volume information), Figures 3 to 6, 8, 10, 12 and 13, and the financial data included in Figures 7, 9, 11 and 14 of this press release have been extracted from the underlying accounting records as of and for the six months ended 30 June 2025. References in this document to materials on our websites, such as www.ab-inbev.com, are included as an aid to their location and are not incorporated by reference into this document.
Conference call and webcast
Investor Conference call and webcast on Thursday, 31 July 2025:
3.00pm Brussels / 2.00pm London / 9.00am New York
Registration details:
Webcast (listen-only mode):
AB InBev 2Q25 Results Webcast
To join by phone, please use one of the following two phone numbers:
Toll-Free: +1-877-407-8029
Toll: +1-201-689-8029
About AB InBev
Anheuser-Busch InBev (AB InBev) is a publicly traded company (Euronext: ABI) based in Leuven, Belgium, with secondary listings on the Mexico (MEXBOL: ANB) and South Africa (JSE: ANH) stock exchanges and with American Depositary Receipts on the New York Stock Exchange (NYSE: BUD). As a company, we dream big to create a future with more cheers. We are always looking to serve up new ways to meet life’s moments, move our industry forward and make a meaningful impact in the world. We are committed to building great brands that stand the test of time and to brewing the best beers using the finest ingredients. Our diverse portfolio of well over 500 beer brands includes global brands Budweiser®, Corona®, Stella Artois® and Michelob Ultra®; multi-country brands Beck’s®, Hoegaarden® and Leffe®; and local champions such as Aguila®, Antarctica®, Bud Light®, Brahma®, Cass®, Castle®, Castle Lite®, Cristal®, Harbin®, Jupiler®, Modelo Especial®, Quilmes®, Victoria®, Sedrin®, and Skol®. Our brewing heritage dates back more than 600 years, spanning continents and generations. From our European roots at the Den Hoorn brewery in Leuven, Belgium. To the pioneering spirit of the Anheuser & Co brewery in St. Louis, US. To the creation of the Castle Brewery in South Africa during the Johannesburg gold rush. To Bohemia, the first brewery in Brazil. Geographically diversified with a balanced exposure to developed and developing markets, we leverage the collective strengths of approximately 144 000 colleagues based in nearly 50 countries worldwide. For 2024, AB InBev’s reported revenue was 59.8 billion USD (excluding JVs and associates).
Annex 1: Segment reporting (2Q)
| AB InBev Worldwide | 2Q24 | Scope | Currency Translation | Organic Growth | 2Q25 | Organic Growth | ||||||||||||
| Volumes | 146 302 |
| (224 | ) | - |
| (2 730 | ) | 143 347 |
| (1.9 | )% | ||||||
| Revenue | 15 333 |
| (100 | ) | (688 | ) | 458 |
| 15 004 |
| 3.0 | % | ||||||
| Cost of sales | (6 766 | ) | 25 |
| 298 |
| (115 | ) | (6 558 | ) | (1.7 | )% | ||||||
| Gross profit | 8 567 |
| (75 | ) | (389 | ) | 343 |
| 8 446 |
| 4.0 | % | ||||||
| SG&A | (4 813 | ) | 1 |
| 186 |
| 2 |
| (4 624 | ) | 0.0 | % | ||||||
| Other operating income/(expenses) | 151 |
| (0 | ) | (11 | ) | 52 |
| 191 |
| 35.2 | % | ||||||
| Normalized EBIT | 3 905 |
| (74 | ) | (215 | ) | 397 |
| 4 013 |
| 10.2 | % | ||||||
| Normalized EBITDA | 5 302 |
| (74 | ) | (268 | ) | 341 |
| 5 301 |
| 6.5 | % | ||||||
| Normalized EBITDA margin | 34.6 | % | 35.3 | % | 116bps | |||||||||||||
|
| ||||||||||||||||||
| North America | 2Q24 | Scope | Currency Translation | Organic Growth | 2Q25 | Organic Growth | ||||||||||||
| Volumes | 22 639 |
| (330 | ) | - |
| 68 |
| 22 376 |
| 0.3 | % | ||||||
| Revenue | 3 864 |
| (89 | ) | (13 | ) | 82 |
| 3 844 |
| 2.2 | % | ||||||
| Cost of sales | (1 606 | ) | 71 |
| 4 |
| (6 | ) | (1 537 | ) | (0.4 | )% | ||||||
| Gross profit | 2 258 |
| (18 | ) | (8 | ) | 76 |
| 2 307 |
| 3.4 | % | ||||||
| SG&A | (1 101 | ) | (2 | ) | 3 |
| (23 | ) | (1 122 | ) | (2.0 | )% | ||||||
| Other operating income/(expenses) | 4 |
| - |
| 0 |
| 5 |
| 10 |
| - |
| ||||||
| Normalized EBIT | 1 161 |
| (21 | ) | (5 | ) | 59 |
| 1 195 |
| 5.1 | % | ||||||
| Normalized EBITDA | 1 338 |
| (21 | ) | (5 | ) | 60 |
| 1 372 |
| 4.5 | % | ||||||
| Normalized EBITDA margin | 34.6 | % | 35.7 | % | 81bps | |||||||||||||
|
| ||||||||||||||||||
| Middle Americas | 2Q24 | Scope | Currency Translation | Organic Growth | 2Q25 | Organic Growth | ||||||||||||
| Volumes | 38 381 |
| - |
| - |
| 441 |
| 38 822 |
| 1.1 | % | ||||||
| Revenue | 4 522 |
| (13 | ) | (400 | ) | 230 |
| 4 340 |
| 5.1 | % | ||||||
| Cost of sales | (1 593 | ) | (16 | ) | 135 |
| (43 | ) | (1 516 | ) | (2.7 | )% | ||||||
| Gross profit | 2 929 |
| (29 | ) | (265 | ) | 188 |
| 2 824 |
| 6.4 | % | ||||||
| SG&A | (1 100 | ) | 10 |
| 91 |
| 11 |
| (987 | ) | 1.0 | % | ||||||
| Other operating income/(expenses) | 11 |
| - |
| (0 | ) | (8 | ) | 3 |
| (73.2 | )% | ||||||
| Normalized EBIT | 1 841 |
| (18 | ) | (174 | ) | 190 |
| 1 839 |
| 10.4 | % | ||||||
| Normalized EBITDA | 2 219 |
| (18 | ) | (203 | ) | 152 |
| 2 149 |
| 6.9 | % | ||||||
| Normalized EBITDA margin | 49.1 | % | 49.5 | % | 83bps | |||||||||||||
| South America | 2Q24 | Scope | Currency Translation | Organic Growth | 2Q25 |
Organic Growth | ||||||||||||
| Volumes | 35 969 |
| - |
| - |
| (1 770 | ) | 34 199 |
| (4.9 | )% | ||||||
| Revenue | 2 785 |
| (32 | ) | (323 | ) | 99 |
| 2 529 |
| 3.6 | % | ||||||
| Cost of sales | (1 427 | ) | (10 | ) | 180 |
| (57 | ) | (1 314 | ) | (4.0 | )% | ||||||
| Gross profit | 1 358 |
| (42 | ) | (143 | ) | 42 |
| 1 215 |
| 3.1 | % | ||||||
| SG&A | (976 | ) | 7 |
| 119 |
| (13 | ) | (863 | ) | (1.4 | )% | ||||||
| Other operating income/(expenses) | 99 |
| (6 | ) | (12 | ) | 22 |
| 104 |
| 24.7 | % | ||||||
| Normalized EBIT | 482 |
| (41 | ) | (36 | ) | 51 |
| 456 |
| 10.9 | % | ||||||
| Normalized EBITDA | 750 |
| (41 | ) | (70 | ) | 53 |
| 692 |
| 7.2 | % | ||||||
| Normalized EBITDA margin | 26.9 | % | 27.4 | % | 93bps | |||||||||||||
| EMEA | 2Q24 | Scope | Currency Translation | Organic Growth | 2Q25 | Organic Growth | ||||||||||||
| Volumes | 23 852 |
| 112 |
| - |
| 208 |
| 24 172 |
| 0.9 | % | ||||||
| Revenue | 2 301 |
| 9 |
| 60 |
| 118 |
| 2 489 |
| 5.2 | % | ||||||
| Cost of sales | (1 179 | ) | 2 |
| (31 | ) | (44 | ) | (1 252 | ) | (3.8 | )% | ||||||
| Gross profit | 1 122 |
| 12 |
| 29 |
| 74 |
| 1 237 |
| 6.7 | % | ||||||
| SG&A | (691 | ) | (21 | ) | (24 | ) | (27 | ) | (764 | ) | (3.8 | )% | ||||||
| Other operating income/(expenses) | 34 |
| 5 |
| 2 |
| 15 |
| 56 |
| 37.4 | % | ||||||
| Normalized EBIT | 465 |
| (4 | ) | 6 |
| 63 |
| 529 |
| 13.7 | % | ||||||
| Normalized EBITDA | 721 |
| (4 | ) | 15 |
| 68 |
| 800 |
| 9.5 | % | ||||||
| Normalized EBITDA margin | 31.3 | % | 32.1 | % | 129bps | |||||||||||||
|
| ||||||||||||||||||
| Asia Pacific | 2Q24 | Scope | Currency Translation | Organic Growth | 2Q25 | Organic Growth | ||||||||||||
| Volumes | 25 399 |
| - |
| - |
| (1 683 | ) | 23 716 |
| (6.6 | )% | ||||||
| Revenue | 1 749 |
| 0 |
| (13 | ) | (78 | ) | 1 658 |
| (4.5 | )% | ||||||
| Cost of sales | (821 | ) | (7 | ) | 6 |
| 50 |
| (771 | ) | 6.1 | % | ||||||
| Gross profit | 928 |
| (7 | ) | (7 | ) | (28 | ) | 886 |
| (3.0 | )% | ||||||
| SG&A | (549 | ) | 1 |
| 5 |
| 24 |
| (520 | ) | 4.3 | % | ||||||
| Other operating income/(expenses) | 30 |
| 0 |
| - |
| (14 | ) | 17 |
| (45.1 | )% | ||||||
| Normalized EBIT | 410 |
| (7 | ) | (3 | ) | (18 | ) | 383 |
| (4.4 | )% | ||||||
| Normalized EBITDA | 570 |
| (6 | ) | (3 | ) | (27 | ) | 533 |
| (4.8 | )% | ||||||
| Normalized EBITDA margin | 32.6 | % | 32.2 | % | (9)bps | |||||||||||||
|
| ||||||||||||||||||
| Global Export and Holding Companies | 2Q24 | Scope | Currency Translation | Organic Growth | 2Q25 | Organic Growth | ||||||||||||
| Volumes | 62 |
| (6 | ) | - |
| 6 |
| 62 |
| 10.4 | % | ||||||
| Revenue | 112 |
| 25 |
| 1 |
| 6 |
| 144 |
| 7.2 | % | ||||||
| Cost of sales | (141 | ) | (15 | ) | 5 |
| (15 | ) | (168 | ) | (12.5 | )% | ||||||
| Gross profit | (30 | ) | 10 |
| 5 |
| (9 | ) | (23 | ) | (26.6 | )% | ||||||
| SG&A | (396 | ) | 6 |
| (7 | ) | 30 |
| (368 | ) | 7.8 | % | ||||||
| Other operating income/(expenses) | (28 | ) | 0 |
| (2 | ) | 31 |
| 2 |
| - |
| ||||||
| Normalized EBIT | (453 | ) | 17 |
| (4 | ) | 52 |
| (389 | ) | 11.7 | % | ||||||
| Normalized EBITDA | (295 | ) | 17 |
| (1 | ) | 35 |
| (245 | ) | 12.2 | % | ||||||
Annex 2: Segment reporting (HY)
| AB InBev Worldwide | HY24 | Scope | Currency Translation | Organic Growth | HY25 | Organic Growth | ||||||||||||
| Volumes | 285 837 |
| (498 | ) | - |
| (5 724 | ) | 279 615 |
| (2.0 | )% | ||||||
| Revenue | 29 880 |
| (131 | ) | (1 786 | ) | 669 |
| 28 632 |
| 2.3 | % | ||||||
| Cost of sales | (13 419 | ) | (39 | ) | 770 |
| 87 |
| (12 602 | ) | 0.7 | % | ||||||
| Gross profit | 16 461 |
| (170 | ) | (1 016 | ) | 755 |
| 16 029 |
| 4.6 | % | ||||||
| SG&A | (9 248 | ) | (19 | ) | 510 |
| (55 | ) | (8 812 | ) | (0.6 | )% | ||||||
| Other operating income/(expenses) | 334 |
| 13 |
| (33 | ) | 69 |
| 383 |
| 20.8 | % | ||||||
| Normalized EBIT | 7 547 |
| (176 | ) | (539 | ) | 769 |
| 7 601 |
| 10.3 | % | ||||||
| Normalized EBITDA | 10 288 |
| (174 | ) | (691 | ) | 733 |
| 10 156 |
| 7.2 | % | ||||||
| Normalized EBITDA margin | 34.4 | % | 35.5 | % | 166bps | |||||||||||||
| North America | HY24 | Scope | Currency Translation | Organic Growth | HY25 | Organic Growth | ||||||||||||
| Volumes | 43 992 |
| (474 | ) | - |
| (1 299 | ) | 42 218 |
| (3.0 | )% | ||||||
| Revenue | 7 457 |
| (126 | ) | (38 | ) | (85 | ) | 7 208 |
| (1.2 | )% | ||||||
| Cost of sales | (3 150 | ) | 91 |
| 13 |
| 100 |
| (2 947 | ) | 3.3 | % | ||||||
| Gross profit | 4 307 |
| (35 | ) | (25 | ) | 14 |
| 4 261 |
| 0.3 | % | ||||||
| SG&A | (2 186 | ) | (8 | ) | 14 |
| 7 |
| (2 174 | ) | 0.3 | % | ||||||
| Other operating income/(expenses) | (8 | ) | - |
| 1 |
| 31 |
| 23 |
| - |
| ||||||
| Normalized EBIT | 2 112 |
| (43 | ) | (10 | ) | 51 |
| 2 110 |
| 2.5 | % | ||||||
| Normalized EBITDA | 2 464 |
| (43 | ) | (12 | ) | 50 |
| 2 459 |
| 2.0 | % | ||||||
| Normalized EBITDA margin | 33.0 | % | 34.1 | % | 108bps | |||||||||||||
| Middle Americas | HY24 | Scope | Currency Translation | Organic Growth | HY25 |
Organic Growth | ||||||||||||
| Volumes | 74 072 |
| - |
| - |
| (169 | ) | 73 903 |
| (0.2 | )% | ||||||
| Revenue | 8 574 |
| (25 | ) | (799 | ) | 374 |
| 8 124 |
| 4.4 | % | ||||||
| Cost of sales | (3 179 | ) | (30 | ) | 273 |
| 70 |
| (2 866 | ) | 2.2 | % | ||||||
| Gross profit | 5 395 |
| (55 | ) | (526 | ) | 444 |
| 5 258 |
| 8.3 | % | ||||||
| SG&A | (2 065 | ) | 16 |
| 192 |
| (42 | ) | (1 898 | ) | (2.1 | )% | ||||||
| Other operating income/(expenses) | 23 |
| - |
| (2 | ) | (7 | ) | 14 |
| (31.2 | )% | ||||||
| Normalized EBIT | 3 353 |
| (38 | ) | (336 | ) | 395 |
| 3 374 |
| 11.9 | % | ||||||
| Normalized EBITDA | 4 105 |
| (38 | ) | (404 | ) | 344 |
| 4 007 |
| 8.4 | % | ||||||
| Normalized EBITDA margin | 47.9 | % | 49.3 | % | 186bps | |||||||||||||
| South America | HY24 | Scope | Currency Translation | Organic Growth | HY25 |
Organic Growth | ||||||||||||
| Volumes | 76 315 |
| - |
| - |
| (1 226 | ) | 75 089 |
| (1.6 | )% | ||||||
| Revenue | 6 018 |
| 13 |
| (900 | ) | 375 |
| 5 507 |
| 6.2 | % | ||||||
| Cost of sales | (3 013 | ) | (99 | ) | 461 |
| (113 | ) | (2 764 | ) | (3.7 | )% | ||||||
| Gross profit | 3 005 |
| (86 | ) | (438 | ) | 262 |
| 2 743 |
| 8.7 | % | ||||||
| SG&A | (1 917 | ) | (26 | ) | 287 |
| (57 | ) | (1 712 | ) | (2.9 | )% | ||||||
| Other operating income/(expenses) | 215 |
| 3 |
| (30 | ) | 14 |
| 201 |
| 6.9 | % | ||||||
| Normalized EBIT | 1 304 |
| (109 | ) | (181 | ) | 219 |
| 1 233 |
| 17.2 | % | ||||||
| Normalized EBITDA | 1 834 |
| (106 | ) | (262 | ) | 233 |
| 1 699 |
| 12.9 | % | ||||||
| Normalized EBITDA margin | 30.5 | % | 30.9 | % | 188bps | |||||||||||||
| EMEA | HY24 | Scope | Currency Translation | Organic Growth | HY25 | Organic Growth | ||||||||||||
| Volumes | 44 882 |
| 77 |
| - |
| (35 | ) | 44 924 |
| (0.1 | )% | ||||||
| Revenue | 4 228 |
| 1 |
| 16 |
| 209 |
| 4 454 |
| 5.0 | % | ||||||
| Cost of sales | (2 215 | ) | 13 |
| (5 | ) | (72 | ) | (2 280 | ) | (3.3 | )% | ||||||
| Gross profit | 2 014 |
| 14 |
| 11 |
| 136 |
| 2 174 |
| 6.8 | % | ||||||
| SG&A | (1 305 | ) | (37 | ) | (9 | ) | (20 | ) | (1 371 | ) | (1.5 | )% | ||||||
| Other operating income/(expenses) | 79 |
| 11 |
| 0 |
| 11 |
| 101 |
| 12.5 | % | ||||||
| Normalized EBIT | 787 |
| (13 | ) | 2 |
| 128 |
| 904 |
| 16.5 | % | ||||||
| Normalized EBITDA | 1 290 |
| (13 | ) | 5 |
| 142 |
| 1 424 |
| 11.1 | % | ||||||
| Normalized EBITDA margin | 30.5 | % | 32.0 | % | 177bps | |||||||||||||
|
| ||||||||||||||||||
| Asia Pacific | HY24 | Scope | Currency Translation | Organic Growth | HY25 | Organic Growth | ||||||||||||
| Volumes | 46 444 |
| (93 | ) | - |
| (2 987 | ) | 43 365 |
| (6.4 | )% | ||||||
| Revenue | 3 383 |
| (7 | ) | (65 | ) | (203 | ) | 3 108 |
| (6.0 | )% | ||||||
| Cost of sales | (1 583 | ) | (9 | ) | 29 |
| 108 |
| (1 456 | ) | 6.8 | % | ||||||
| Gross profit | 1 800 |
| (16 | ) | (37 | ) | (95 | ) | 1 652 |
| (5.3 | )% | ||||||
| SG&A | (994 | ) | (2 | ) | 21 |
| 35 |
| (941 | ) | 3.5 | % | ||||||
| Other operating income/(expenses) | 56 |
| 0 |
| (0 | ) | (15 | ) | 41 |
| (26.7 | )% | ||||||
| Normalized EBIT | 861 |
| (18 | ) | (16 | ) | (75 | ) | 752 |
| (8.8 | )% | ||||||
| Normalized EBITDA | 1 186 |
| (18 | ) | (21 | ) | (90 | ) | 1 056 |
| (7.7 | )% | ||||||
| Normalized EBITDA margin | 35.0 | % | 34.0 | % | (62)bps | |||||||||||||
| Global Export and Holding Companies | HY24 | Scope | Currency Translation | Organic Growth | HY25 | Organic Growth | ||||||||||||
| Volumes | 132 |
| (9 | ) | - |
| (7 | ) | 116 |
| (5.7 | )% | ||||||
| Revenue | 221 |
| 12 |
| 0 |
| (2 | ) | 231 |
| (0.8 | )% | ||||||
| Cost of sales | (279 | ) | (5 | ) | (1 | ) | (5 | ) | (290 | ) | (2.1 | )% | ||||||
| Gross profit | (59 | ) | 7 |
| (1 | ) | (7 | ) | (59 | ) | (10.1 | )% | ||||||
| SG&A | (781 | ) | 38 |
| 5 |
| 22 |
| (716 | ) | 3.0 | % | ||||||
| Other operating income/(expenses) | (31 | ) | 0 |
| (2 | ) | 35 |
| 2 |
| - |
| ||||||
| Normalized EBIT | (870 | ) | 45 |
| 2 |
| 51 |
| (773 | ) | 6.1 | % | ||||||
| Normalized EBITDA | (590 | ) | 45 |
| 2 |
| 54 |
| (489 | ) | 9.9 | % | ||||||
Annex 3: Consolidated statement of financial position
| Million US dollar | 31 December 2024 | 30 June 2025 | ||
| ASSETS | ||||
| Non-current assets | ||||
| Property, plant and equipment | 23 503 | 23 854 | ||
| Goodwill | 110 479 | 114 782 | ||
| Intangible assets | 40 034 | 41 096 | ||
| Investments in associates | 4 612 | 4 878 | ||
| Investment securities | 168 | 152 | ||
| Deferred tax assets | 2 493 | 2 730 | ||
| Pensions and similar obligations | 42 | 101 | ||
| Income tax receivables | 470 | 426 | ||
| Derivatives | 261 | 44 | ||
| Trade and other receivables | 1 577 | 1 829 | ||
| Total non-current assets | 183 637 | 189 892 | ||
|
| ||||
| Current assets | ||||
| Investment securities | 221 | 205 | ||
| Inventories | 5 020 | 5 475 | ||
| Income tax receivables | 727 | 872 | ||
| Derivatives | 554 | 340 | ||
| Trade and other receivables | 5 270 | 6 994 | ||
| Cash and cash equivalents | 11 174 | 7 167 | ||
| Assets classified as held for sale | 33 | 161 | ||
| Total current assets | 22 999 | 21 215 | ||
|
| ||||
| Total assets | 206 637 | 211 107 | ||
|
| ||||
| EQUITY AND LIABILITIES | ||||
| Equity | ||||
| Issued capital | 1 736 | 1 736 | ||
| Share premium | 17 620 | 17 620 | ||
| Reserves | 12 304 | 13 674 | ||
| Retained earnings | 46 577 | 47 641 | ||
| Equity attributable to equity holders of AB InBev | 78 237 | 80 671 | ||
|
| ||||
| Non-controlling interests | 10 463 | 10 743 | ||
| Total equity | 88 700 | 91 414 | ||
|
| ||||
| Non-current liabilities | ||||
| Interest-bearing loans and borrowings | 70 720 | 71 979 | ||
| Pensions and similar obligations | 1 296 | 1 287 | ||
| Deferred tax liabilities | 11 321 | 11 385 | ||
| Income tax payables | 284 | 296 | ||
| Derivatives | 68 | 372 | ||
| Trade and other payables | 797 | 1 013 | ||
| Provisions | 385 | 352 | ||
| Total non-current liabilities | 84 871 | 86 683 | ||
|
| ||||
| Current liabilities | ||||
| Bank overdrafts | - | 21 | ||
| Interest-bearing loans and borrowings | 1 449 | 3 578 | ||
| Income tax payables | 1 805 | 1 386 | ||
| Derivatives | 5 817 | 5 609 | ||
| Trade and other payables | 23 804 | 22 188 | ||
| Provisions | 191 | 202 | ||
| Liabilities associated with assets held for sale | - | 25 | ||
| Total current liabilities | 33 066 | 33 009 | ||
|
| ||||
| Total equity and liabilities | 206 637 | 211 107 |
Annex 4: Consolidated statement of cash flows
| For the six-month period ended 30 June | ||||||
| Million US dollar | 2024 | 2025 | ||||
| OPERATING ACTIVITIES | ||||||
| Profit of the period | 3 236 |
| 4 568 |
| ||
| Depreciation, amortization and impairment | 2 741 |
| 2 581 |
| ||
| Net finance expense/(income) | 2 887 |
| 1 678 |
| ||
| Equity-settled share-based payment expense | 315 |
| 309 |
| ||
| Income tax expense | 1 546 |
| 1 404 |
| ||
| Share of results of associates | (241 | ) | (144 | ) | ||
| Other non-cash items | 339 |
| (93 | ) | ||
| Cash flow from operating activities before changes in working capital and use of provisions | 10 824 |
| 10 304 |
| ||
| Decrease/(increase) in trade and other receivables | (1 154 | ) | (1 130 | ) | ||
| Decrease/(increase) in inventories | (325 | ) | (242 | ) | ||
| Increase/(decrease) in trade and other payables | (2 691 | ) | (2 284 | ) | ||
| Pension contributions and use of provisions | (251 | ) | (278 | ) | ||
| Cash generated from operations | 6 403 |
| 6 370 |
| ||
| Interest paid | (2 001 | ) | (1 916 | ) | ||
| Interest received | 303 |
| 241 |
| ||
| Dividends received | 123 |
| 135 |
| ||
| Income tax paid | (2 260 | ) | (2 126 | ) | ||
| Cash flow from/(used in) operating activities | 2 568 |
| 2 704 |
| ||
| INVESTING ACTIVITIES | ||||||
| Acquisition of property, plant and equipment and of intangible assets | (1 735 | ) | (1 404 | ) | ||
| Proceeds from sale of property, plant and equipment and of intangible assets | 52 |
| 55 |
| ||
| Sale/(acquisition) of subsidiaries, net of cash | (19 | ) | (4 | ) | ||
| Proceeds from sale/(acquisition) of other assets | (29 | ) | 47 |
| ||
| Cash flow from/(used in) investing activities | (1 732 | ) | (1 306 | ) | ||
| FINANCING ACTIVITIES | ||||||
| Proceeds from borrowings | 5 466 |
| 4 067 |
| ||
| Repayments of borrowings | (4 342 | ) | (3 998 | ) | ||
| Dividends paid | (2 142 | ) | (3 147 | ) | ||
| Share buyback | (838 | ) | (1 901 | ) | ||
| Payment of lease liabilities | (406 | ) | (354 | ) | ||
| Derivative financial instruments | (172 | ) | 114 |
| ||
| Sale/(acquisition) of non-controlling interests | (414 | ) | (314 | ) | ||
| Other financing cash flows | (465 | ) | (303 | ) | ||
| Cash flow from/(used in) financing activities | (3 313 | ) | (5 837 | ) | ||
| Net increase/(decrease) in cash and cash equivalents | (2 476 | ) | (4 438 | ) | ||
| Cash and cash equivalents less bank overdrafts at beginning of year | 10 314 |
| 11 174 |
| ||
| Effect of exchange rate fluctuations | (463 | ) | 410 |
| ||
| Cash and cash equivalents less bank overdrafts at end of period | 7 375 |
| 7 146 |
| ||
Investors
Shaun Fullalove
E-mail: shaun.fullalove@ab-inbev.com
Ekaterina Baillie
E-mail: ekaterina.baillie@ab-inbev.com
Cyrus Nentin
E-mail: cyrus.nentin@ab-inbev.com
Media
Media Relations
E-mail: media.relations@ab-inbev.com

AB InBev's three strategic pillars.
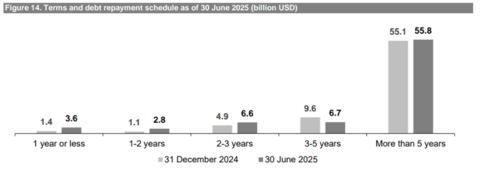
Figure 14. Terms and debt repayment schedule as of 30 June 2025 (billion USD)
